Telemetry Architecture
note
This page details how to collect telemetry necessary for operating Service Bridge, not applications managed by Service Bridge.
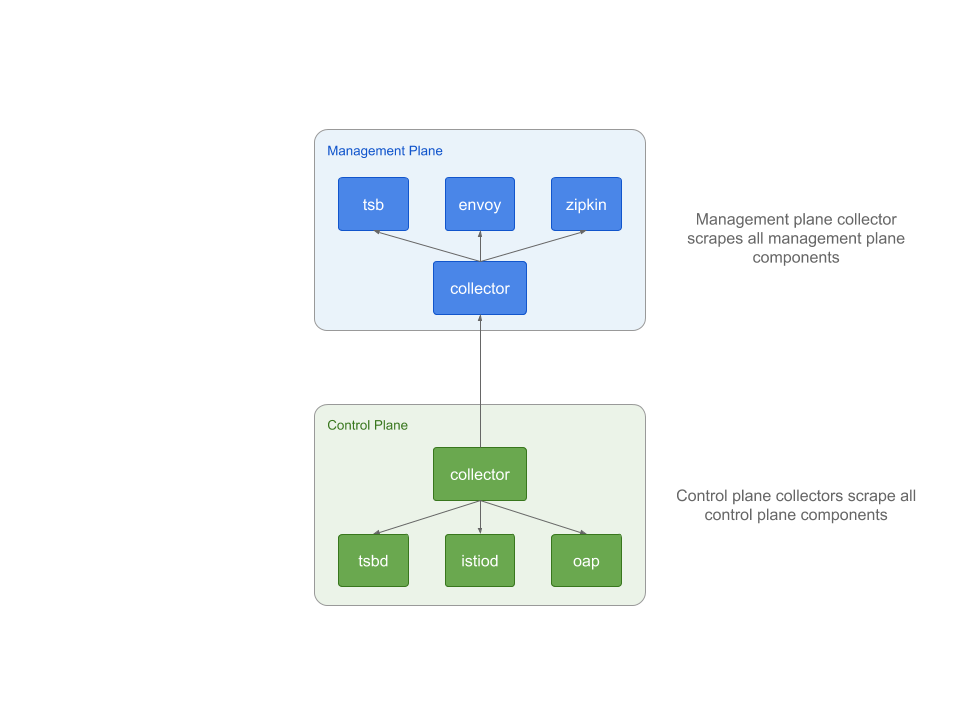
Service Bridge uses Open Telemetry Collector to simplify metrics collection. We deploy one in the management plane and one alongside each control plane. Using the Collector enables Service Bridge to simplify telemetry collection by only requiring operators scrape a single component, rather than all components.

Management Plane
In the management plane there is a component called the collector. It is an aggregator that exposes a single endpoint to scrape all
management plane components. Currently, only metrics are exposed.
The collector exposes an endpoint that can be scraped by Prometheus. To see the output of this endpoint, it can be queried as follows:
kubectl port-forward -n <managementplane-namespace> svc/otel-collector 9090:9090 &
curl localhost:9090/metrics
...
# Metric from the API server in the management plane.
persistence_transaction_duration_count{component="tsb",plane="management"} 4605
caution
Although the Control Plane collectors forward some metrics to the Management Plane you should not rely on these being present in production installations. Instead, you should scrape each collector locally.
Control Plane
In each control plane there is also a collector that exposes a metrics endpoint for components in its control plane. This collector can be scraped by Prometheus in the same way as the management plane collector.
To see the output of this endpoint, it can be queried as follows:
kubectl port-forward -n <controlplane-namespace> svc/otel-collector 9090:9090 &
curl localhost:9090/metrics